You can choose to map indicators of wellbeing for the full population of South Africa, or for different age groups. The list of indicators displayed are those that are relevant to the selected age group: not all indicators that are relevant for children, would be relevant for working age or older people, for instance.
The numbers and proportions shown on the Youth tab on the Community Explorer are slightly different to those found on the Youth Explorer, even though they are for the same population group. This is because of 2 differences in the data used: Firstly, we are currently using the 10% sample of the 2011 census on the Community Explorer, while the full census dataset is used for the Youth Explorer. Secondly, the sample for the Community Explorer indicators excludes non-usual residents, whereas the Youth Explorer indicators have been calculated to include non-usual residents. Once access to the full 2011 census dataset has been obtained, the Community Explorer indicators will be updated accordingly with the full 2011 census sample, excluding non-usual residents.
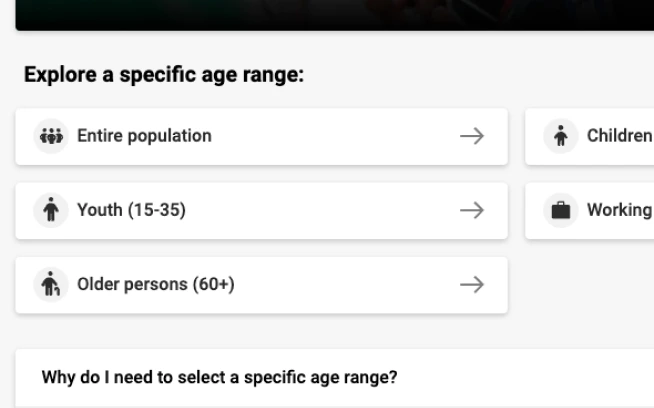
You can choose to map indicators of wellbeing for the full population of South Africa, or for different age groups. The list of indicators displayed are those that are relevant to the selected age group: not all indicators that are relevant for children, would be relevant for working age or older people, for instance.
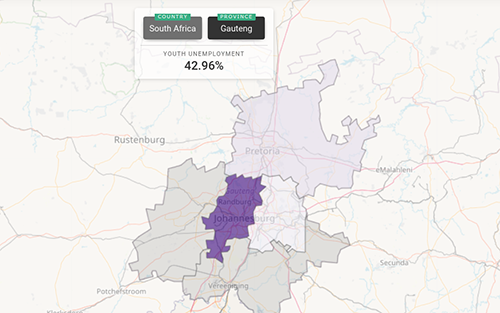
Search for a location of interest and explore various measures of wellbeing of the young people who live there. Youth Explorer uses census data to provide a comprehensive picture of youth wellbeing, from the national down to the ward and main place (suburb) level.
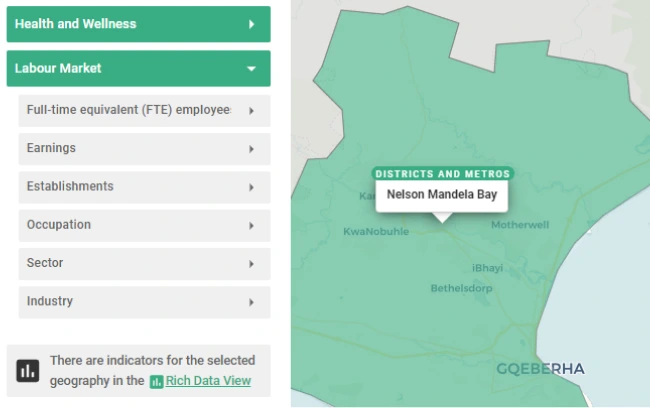
The labour market indicators are developed using the Spatial Tax Panel (FTE employees; Earnings; Establishments), and the census 10% sample (Occupation; Sector; Industry). The Spatial Tax Panel provides current data, from 2014 to 2023, for formal, full time equivalent employees, employed by firms that file tax returns. The census data provides information on both the formal and informal labour market, for all workers, in 2011.
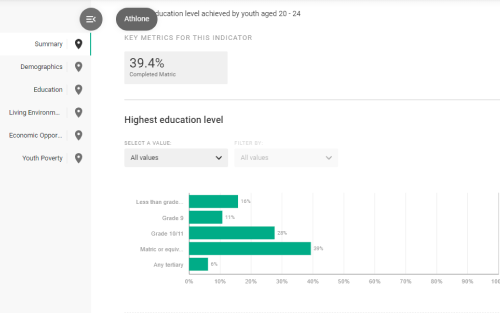
Rich, youth-specific data relating to various categories of wellbeing is available for all geographies in South Africa. Data is presented for youth aged 15-24 (following the international definition) and 15-35 (following the South African definition).
Disaggregation for smaller age brackets is possible for most indicators. Indicators can also be disaggregated by gender and race.
From basic statistics, to configurable charts - find and download the data you need to work with. The Rich Data can also be downloaded as a PDF fact sheet for your chosen geographic area.
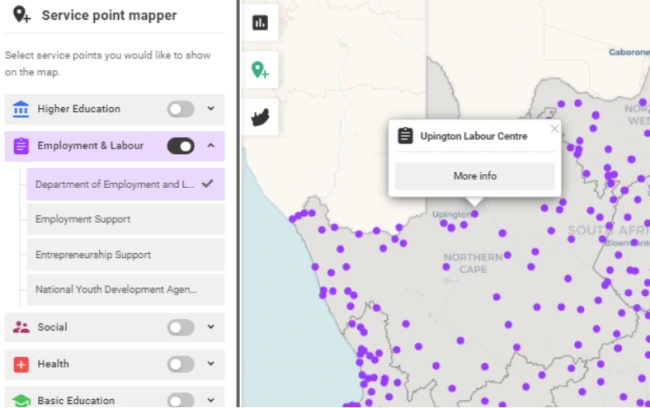
We work with various partners to provide accurate information on government, and some non-government, services relevant to young people. This information can assist youth and those working with youth to identify the services closest to them.
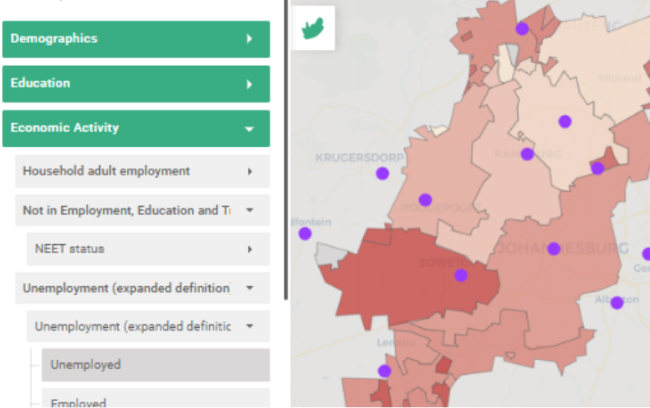
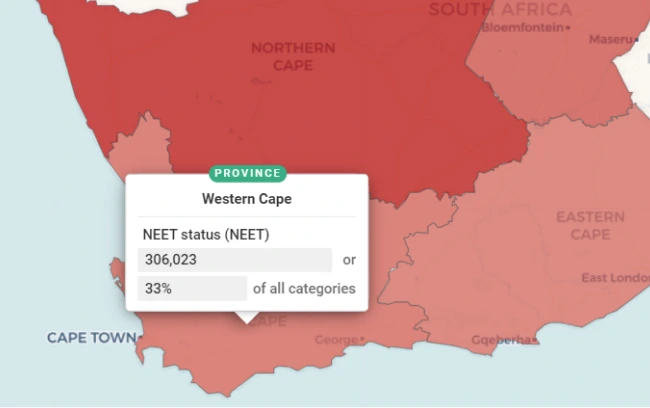
The indicators of wellbeing can be mapped, in the form of a choropleth that shows higher or lower concentrations of well-being or need. That map can then be overlaid with the location of various service points. This provides a rich picture of the status of youth wellbeing in relation to access to services, or the absence thereof. This provides policy and intervention planners with a visual analysis of potential gaps in service provision, where those in the greatest need may not have access to adequate services.
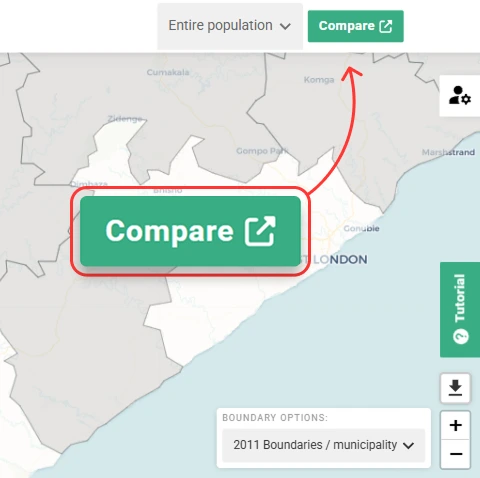
Selecting the “Compare” button in the Map View opens the Tabular Comparison tool.
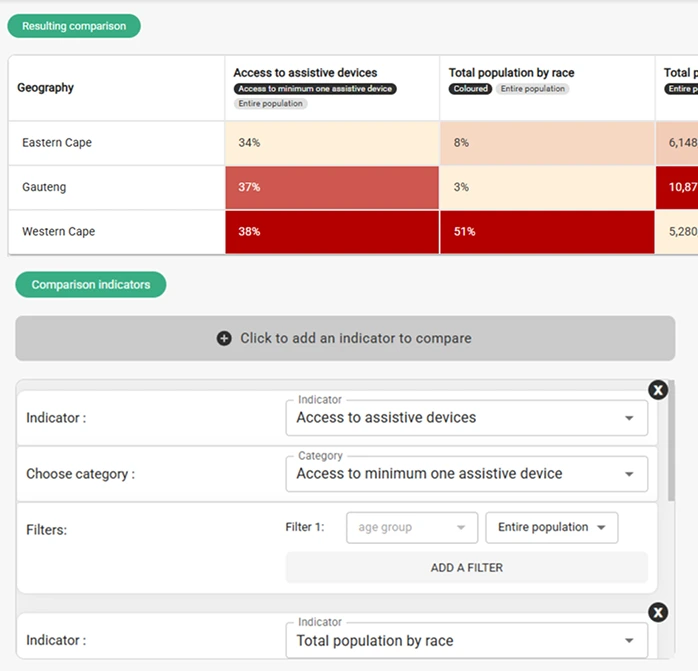
This allows for the comparison of indicators across different geographic areas. This is useful for contextualising findings and for further analysis.
The well-being and labour market indicators are derived from the following sources:
The Youth Explorer contains indicators calculated from the full 2011 census, as well as the 10% sample when the full dataset was not available. The only difference is that the 10% indicators are only available down to the municipal level, and not available for main places, sub places or wards. The well-being indicators are derived using the full version of the census, while the labour market indicators rely on the 10% sample.
Some of the Labour Market indicators are derived from administrative tax data which has been aggregated to create the Spatial Tax Panel. These indicators are developed through a partnership with the Human Sciences Research Council and the National Treasury: City Support Programme. More information on the Spatial Tax Panel can be found here.
The indicators that make up the Youth Multidimensional Labour Market Index are derived using the first quarter of the Quarterly Labour Force Survey for the period 2013 to 2023. Further details on this data can be found here and further details on how these indicators are calculated can be found here.


Please cite Community Explorer as follows:
Community Explorer, SALDRU, University of Cape Town and OpenUp. Retrieved Month, Date, Year from https://communityexplorer.org.za/